|
The Analysis program enables a much deeper examination, analysis, and organization of data collected with the REG-1. When you run the Reflector or FieldREG programs, the REG data is saved locally on your hard drive. With Analysis, you can examine individual sessions in new ways, facilitating discovery of patterns and assisting you in testing hypotheses about the mind-matter effects you observe.
Interact with dynamically generated graphs of your REG-1 data. Examine mean shifts in the direction of your intention. Conduct classic PEAR analyses of your data. Archive and share your findings. Psyleron Analysis—included with all editions of the REG-1—is a versatile tool for exploring and better understanding your data.
|
|
FULL SCREENSHOT
 |
Key Features
- View and manipulate graphical views of your data
- Examine important statistics from your data
- Export images of graphs to save or share with others
- Read comments generated during the course of an experiment
- Add comments and notes about your subjective perceptions
(Standard and Professional editions only)
- Export data for viewing in Excel and other third-party analysis software
(Professional edition only)
|
Select Session Screen (Figure 1)
The Psyleorn Analysis program lets you review the results of previous REG sessions. For convenience, Analysis is launched within Reflector from the module selection screen, or within FieldREG from the main screen. Analysis has features that are specific to individual Reflector modules and to FieldREG.
|
|
FULL SCREENSHOT
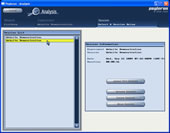
Figure 1 |
The select session screen allows you to easily find sessions within experiments. You can even manage your data by merging entire experiments, or by renaming, merging, deleting, or transfering individual sessions. Once you have selected a session, you can examine it within the Analysis window.
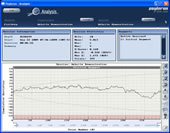
The Analysis Window (Figure 2)
When you first enter the Analysis window, the graph and statistics for your entire session are displayed. In the upper right of the Analysis window, you will see the segment selection box. You may select an individual segment in this box. Once you make a selection, the graph and statistics display the data for the segment you have selected.
|
The Analysis window can be broken down into four parts:
- Module, Experiment, and Session (top row)
- Session Info, Statistics, and Segments (2nd row)
- Cumulative Results Graph (3rd row)
- Graph View Options (far right)
|
|
FULL SCREENSHOT
Figure 2
|
|
Module, Experiment, Session (Figure 2a)
This navigation bar allows you to go back and change the experiment or session without having to exit Analysis.
|
|
FULL SCREENSHOT
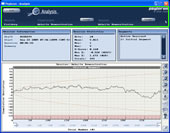
Figure 2a
|
|
Session Info, Statistics, Segments (Figure 2b)
These three windows (Full session/segment information; Selected range information; Ad hoc comments) allow useful and precise wasy of viewing REG-1 data.
On the left, session/segment information includes the start time and duration of the session, along with summary notes entered by the user. You can click and drag the mouse cursor over the graph to select a range of trials, the statistics are specific to only that range of data (appearing in the center). In this way, you can quickly and easily examine the relavant statistics, from the full session down to the smallest highlighted segment of interest. On the right, the comments bubble allows ad hoc commenting in previously collected data.
|
|
FULL SCREENSHOT
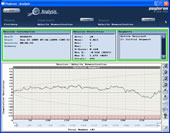
Figure 2b
|
Statistal Features
The statistical features allow bit-level analysis of REG-1 data. Primary statistical metrics include:
- Bits. The number of REG-1 bits making up each trial.
- Mean. The average number of "high" or "1" bits per trial.
- Min and Max. In FieldREG and in some Reflector modules, each trial may be composed of more than one bit. Min is the smallest number of 1-bits in a sample; Max is the largest number of 1-bits in a sample.
- Z-Score. The z-score relates the "distance" an experimental outcome falls from the mean, in standard deviations, in other words, how unlikely it is that your results are due to chance. In practice, it may be thought of as your index of performance: the higher the z-score, the larger the influence on the REG.
- Trials. Indicates the number of trials in a session or segment.

|
Cumulative Results Graph (Figure 2c)
The cumulative results graph allows you to visually compare your results (indicated by the line graph) to the thresholds of statistical significance (indicated by the parabola curves). The theoretical odds are 1 in 20 that the results curve terminates beyond these curves by chance. If “Entire Session” is highlighted, then the graph displays all trials. If an individual segment is selected, then the graph displays only the trials in that segment.
|
|
FULL SCREENSHOT
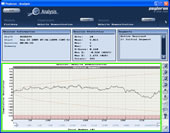
Figure 2c
|
Psyleron provides Consulting and Analytical Services if you require it. We can assist with everything from custom hardware and full experimental design, to analysis and interpretation of previously-collected REG data.
 Back to FieldREG Software
Back to REG-1 Software
|
Reflector, FieldREG, and Analysis are included with each REG-1―our easy-to-use Random Event Generator for your home computer. Plug into your USB port and get started exploring mind-matter interactions.
- Simplify experiments
- Test new techniques
- Explore your own mind
- Create custom applications

|
|